With the ever-increasing number of users on the Internet, the demand for web hosting is constantly on the rise. A reliable web hosting service is necessary to build a successful online business.
In this blog post, we are going to look at 21 Web Hosting Statistics for 2024. These will cover the trends, facts, and statistics spanning various categories, like hosting, domains, servers, data centers, page speeds, web panels, etc.
These statistics will help you gain a better understanding of the web hosting industry. It will also help you get an idea of where the world is currently headed with the different technologies and data.
So, are you ready to dive deeper into some crazy and interesting statistics? Let’s begin!
- Intro
- Web Hosting Statistics for 2023
- 1. In 2023, there are 1.11 billion websites in the world.
- 2. The average page loading time is 2.5 seconds on desktop and 8.6 seconds on mobile.
- 3. The Green Data Centers industry is expected to surpass $175 billion by 2030!
- 4. Google is the most popular hosting technology in India, powering 17% of Indian websites.
- 5. Apache is the most widely used web server in India, powering 42% of Indian websites.
- 6. Websites hosted on VPS hosting load between 15% and 35% faster than those hosted on shared plans.
- 7. 43.2% of all websites on the Internet use WordPress.
- 8. 35.5% of websites use the United States server location.
- 9. The most popular web hosting provider is GoDaddy, being used by 9.71% of websites on the Internet.
- 10. Website conversion rates drop by 4.42% with each second of load time that goes by between zero and five seconds.
- 11. Data downtime multiples by 1.89 times year over year.
- 12. The web hosting industry is expected to grow to $171.4 billion by the year 2027!
- 13. Plesk is the most preferred web panel with 4.6% of websites using it.
- 14. The .com TLD is the most popular domain extension used by 47.8% of all websites.
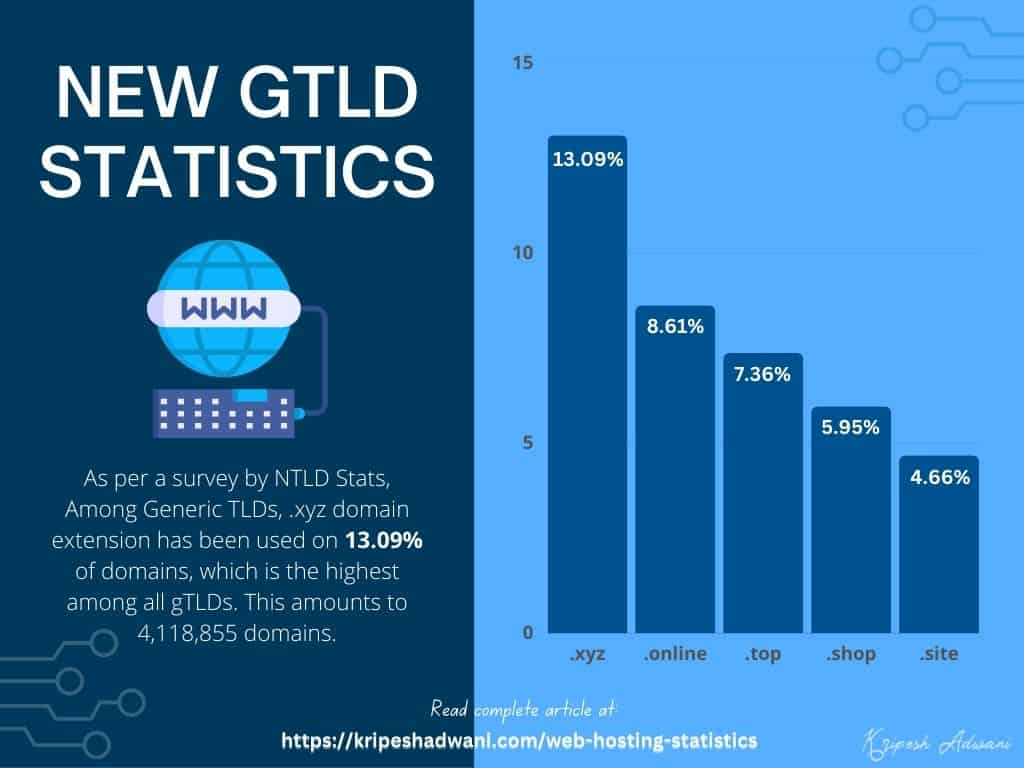
- 15. .xyz is the most popular Generic TLD used by 13.09% of registered domains.
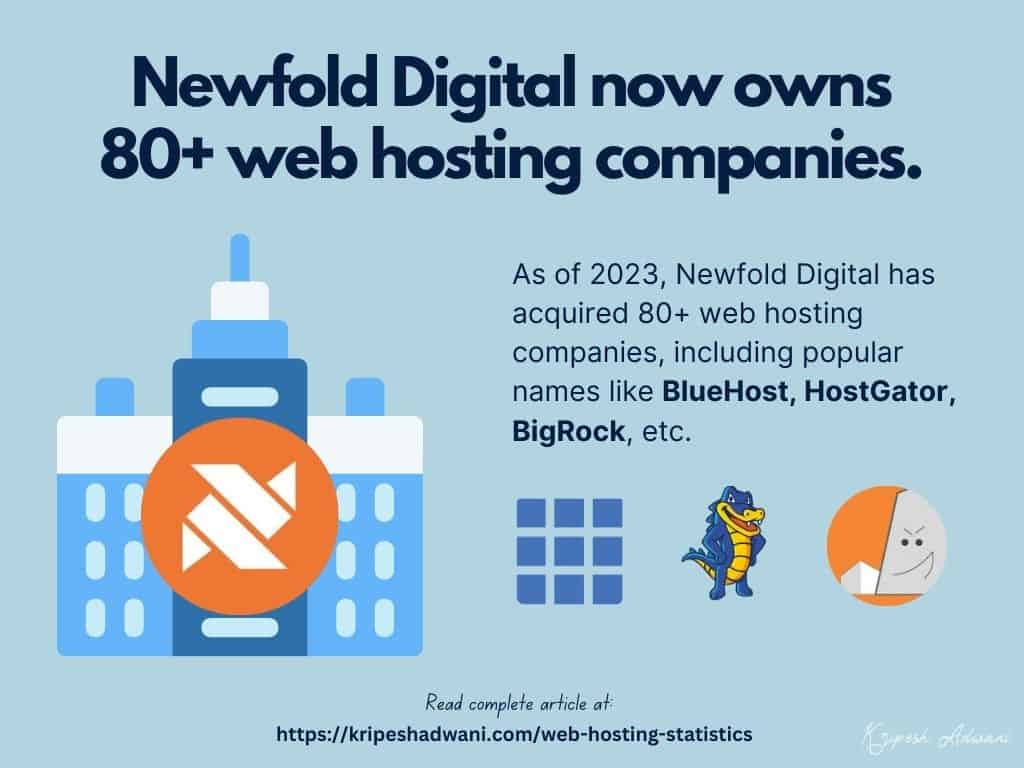
- 16. As of 2023, Newfold Digital owns 80+ web hosting companies.
- 17. The most expensive domain name ever sold was Cars.com at $872 million.
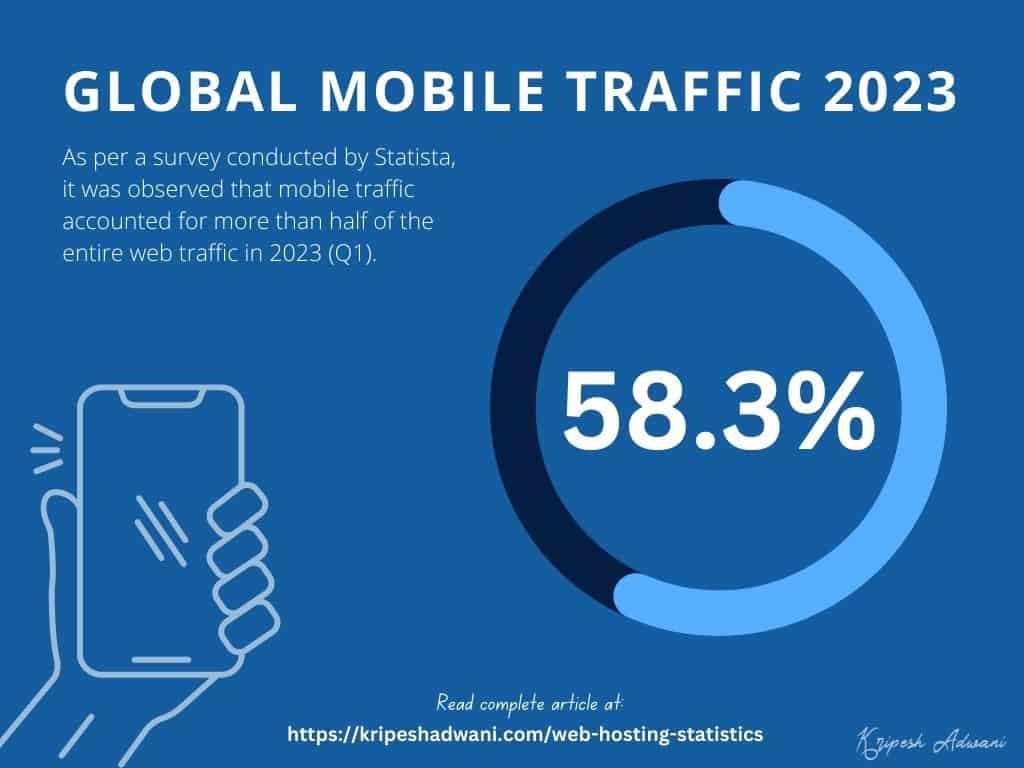
- 18. In the first quarter of 2023, 58.33% of website traffic came from mobile devices.
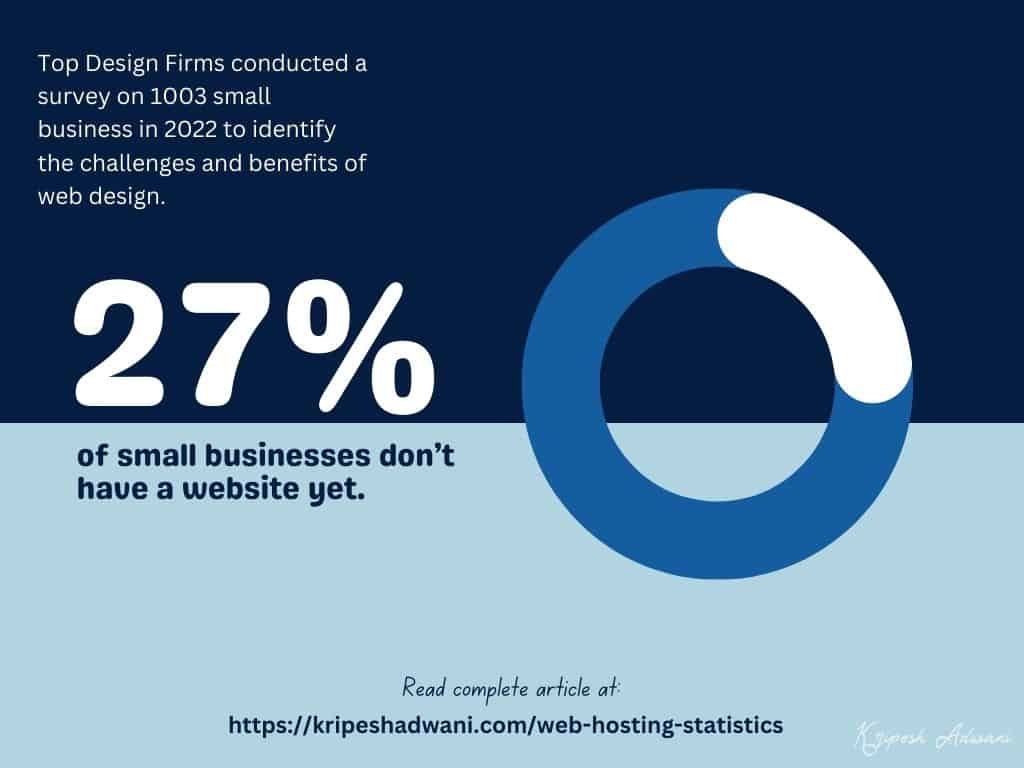
- 19. 27% of small businesses don’t have a website.
- 20. The average web page size has increased from 1.4 MB in 2017 to over 2.3MB in 2023 for desktops.
- 21. 81.2% of websites use the Unix operating system.
- Conclusion
Disclaimer : I strongly believe in transparency. If you buy using the links on our site, we may earn a small commission without any extra cost to you. This helps me to keep producing honest reviews. Read More >>
21 Web Hosting Statistics for 2023
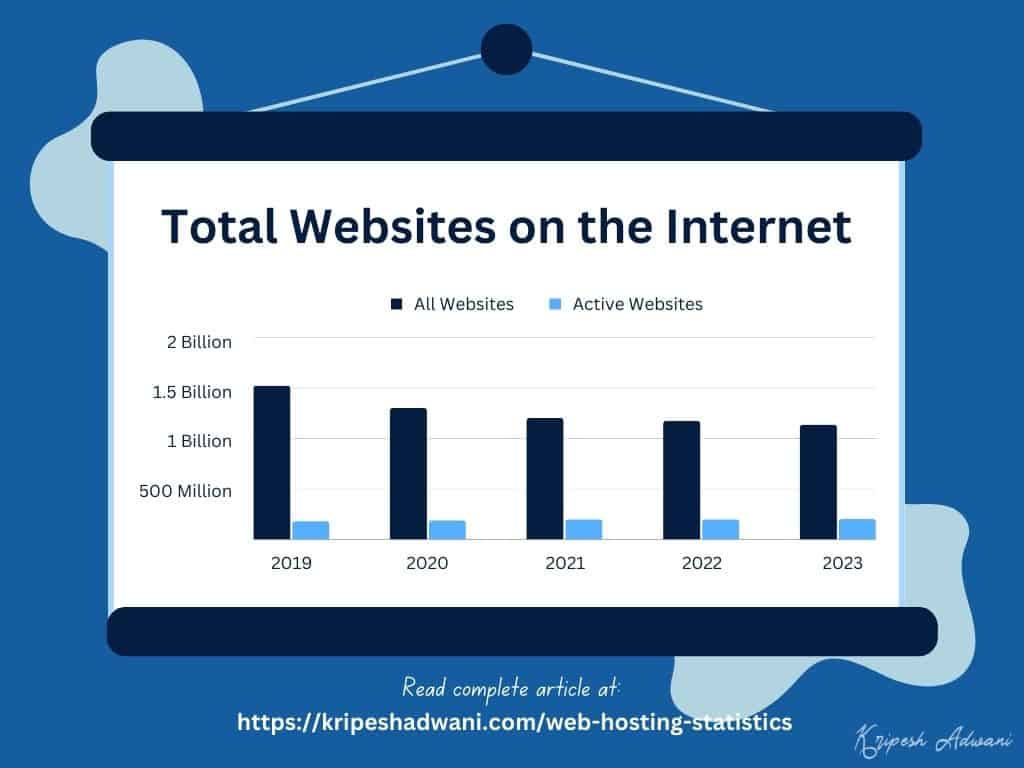
1. In 2023, there are 1.1 billion websites in the world.
According to Netcraft, at the moment, there are around 1.1 billion websites on the Internet. Out of them, only 18.3% (202 million+) websites are active. Thus, for every 5 registered domains, there is roughly 1 active website!
Data Source: Netcraft
Stat Observations:
The ratio of registered websites to the number of active websites has been increasing with every passing year. The reason may be that in the 2000s, people bought websites for business or blogging purposes.
But today, there are multiple reasons people buy websites. For instance, they might buy them for their domain or brand value, future projects, domain flipping, etc.
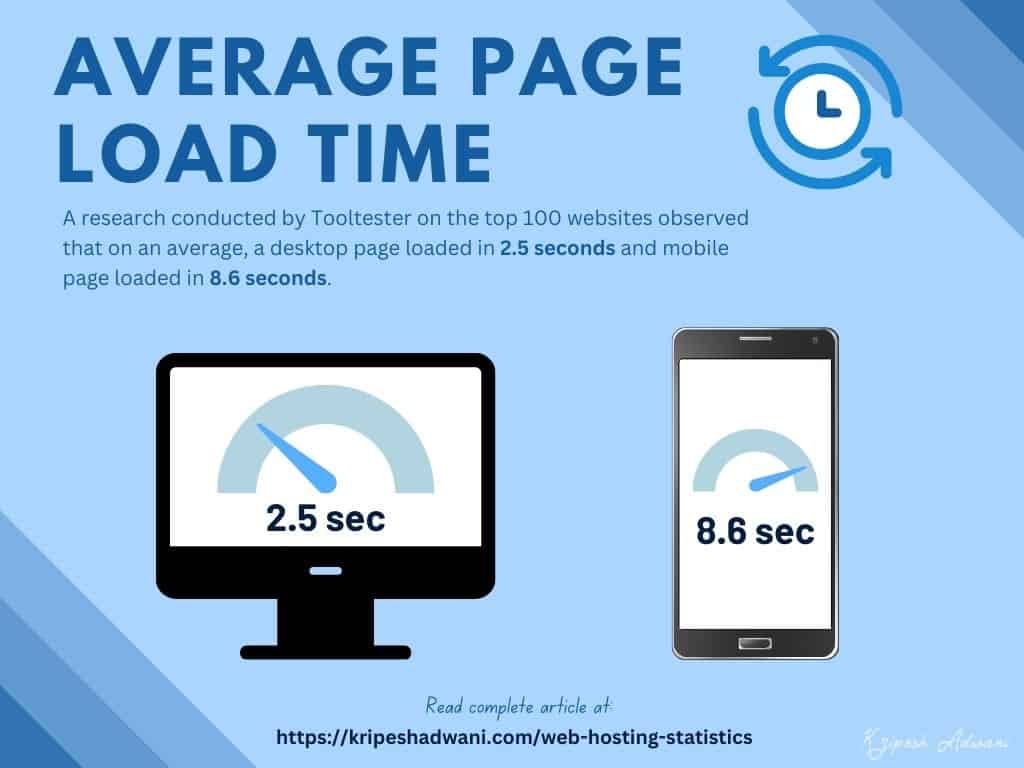
2. The average page loading time is 2.5 seconds on desktop and 8.6 seconds on mobile.
As per research conducted by Tooltester on the top 100 websites, it was observed that a desktop page loaded in 2.5 seconds on average. Whereas, on mobile devices, the average page load time increased to 8.6 seconds.
Data Source: Tooltester
Stat Observation:
There is a large difference between the page load time for desktop and mobile devices. This might be because of a range of factors, like hardware differences, browser differences, network connectivity, etc.
However, one of the major reasons for these results is because of the screen size and resolution. Due to the smaller screen size of mobile devices, the websites that are designed for desktops may need to be scaled down.
This may take up more time and thus result in an extended page load time for mobiles.
3. The Green Data Centers industry is expected to surpass $175 billion by 2030!
As per a survey by Global Market Insights, the market size of Green Data Centers grew to over $45 billion in 2021! And by 2030, it is expected to surpass $175 billion! This points to a compound annual growth rate (CAGR) of over 15%. Baffling, right?

Data Source: Global Market Insights
Stat Observations:
As of April 2023, there are 5.18 billion internet users around the globe. This amounts to 64.6% of the world’s population. With such a huge population using the Internet, the consumption of energy and resources is at its maximum too!
Thus, web hosting companies are coming up with sustainable ways to reduce their carbon footprint. They are finding ways to run their technology in an environmentally friendly way.
Preserving the environment is the need of the hour, and I really support such initiatives. Some popular examples of Green Web Hosting are GreenGeeks, A2 Hosting, InMotion, GoDaddy, etc.
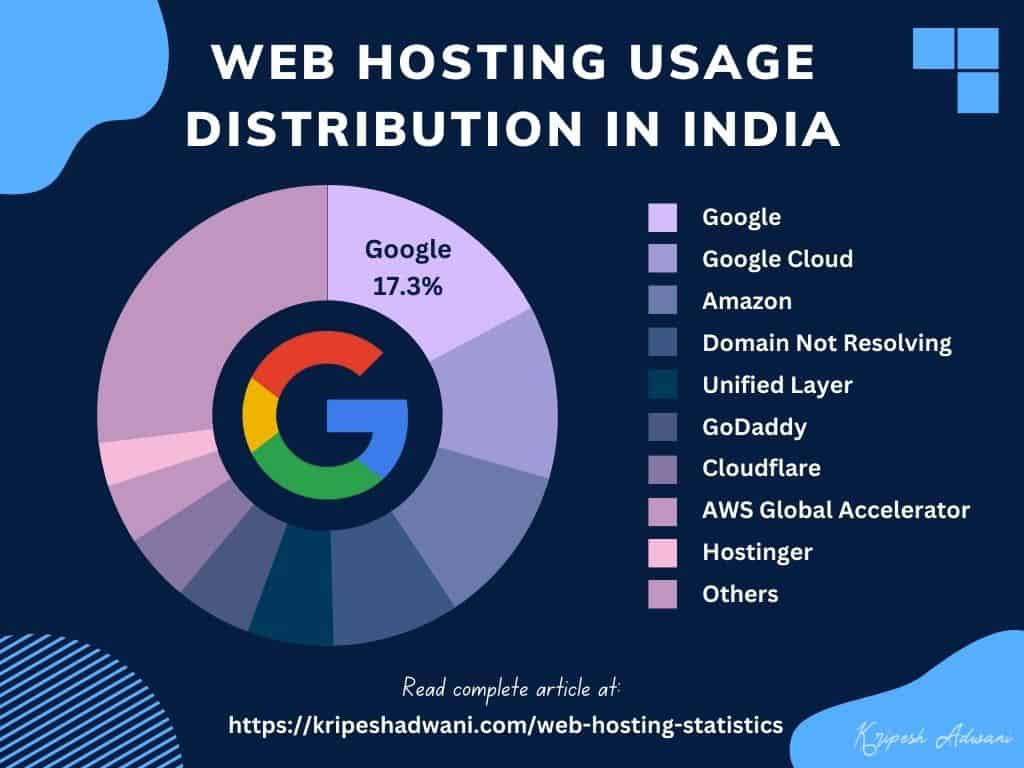
4. Google is the most popular hosting technology in India, powering 17% of Indian websites.
The popularity of a web host depends on the location. Different hosting solutions are popular in different parts of the world.
As per research conducted by BuiltWith, the most popular hosting technology in India and Germany is Google, powering 17% of the total websites. Whereas, if we talk about the US, Amazon is the most popular web hosting technology.
Data Source: BuiltWith
Stat Observations:
The reason Google hosting is popular among Indian users is primarily because of its reliability, scalability, and flexible payment system. You only pay for what you use!
Apart from that, it also offers a developer-friendly environment along with easy integration of Google services like Google Ads, Google Analytics, Google Drive, etc.
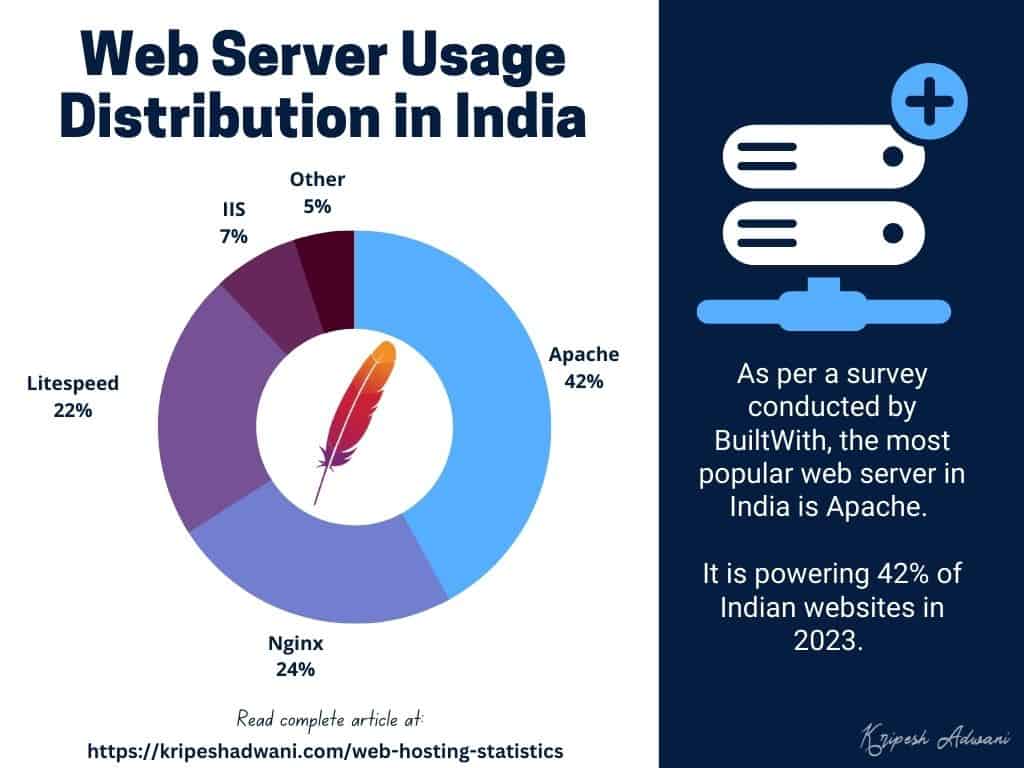
5. Apache is the most widely used web server in India, powering 42% of Indian websites.
As per a survey conducted by BuiltWith, Nginx comes out to be the most popularly used web server around the globe. It’s been used on 37% of total websites, followed by Apache on 31%. If we talk about India, 42% of websites use Apache web servers.
Data Source: BuiltWith
Stat Observations:
Apache web servers are used on a large scale because of their reliability and flexibility. They also have a range of built-in security features in order to secure your website from cyber threats and online attacks.
As of now, Litespeed servers are gaining a lot of popularity in the web hosting industry. Being lightweight and offering faster speeds and performance, they are a great alternative to Apache servers.
With the pace at which web hosting companies are incorporating Litespeed servers in their hosting plans, I think the usage percentage of Litespeed servers is going to see significant growth in the future!
6. Websites hosted on VPS hosting load between 15% and 35% faster than those hosted on shared plans.
According to the stress tests conducted by Elegant Themes on Shared hosting vs VPS Servers, it was observed that by switching to a VPS server from shared hosting, you can expect a performance increase of around 15% to 35%.

Data Source: Elegant Themes
Stat Observations:
The reason VPS hosting has faster loading speeds than shared hosting lies in the way they are designed. In shared hosting, multiple websites are hosted on the same server, and resources like CPU, storage, and RAM are shared between them.
Whereas, on VPS hosting, websites are allocated a private space on a server and each website is allocated a separate CPU, RAM, and storage space. Thus, the allocation of private space and resources is the major contributor to the swift loading speeds.
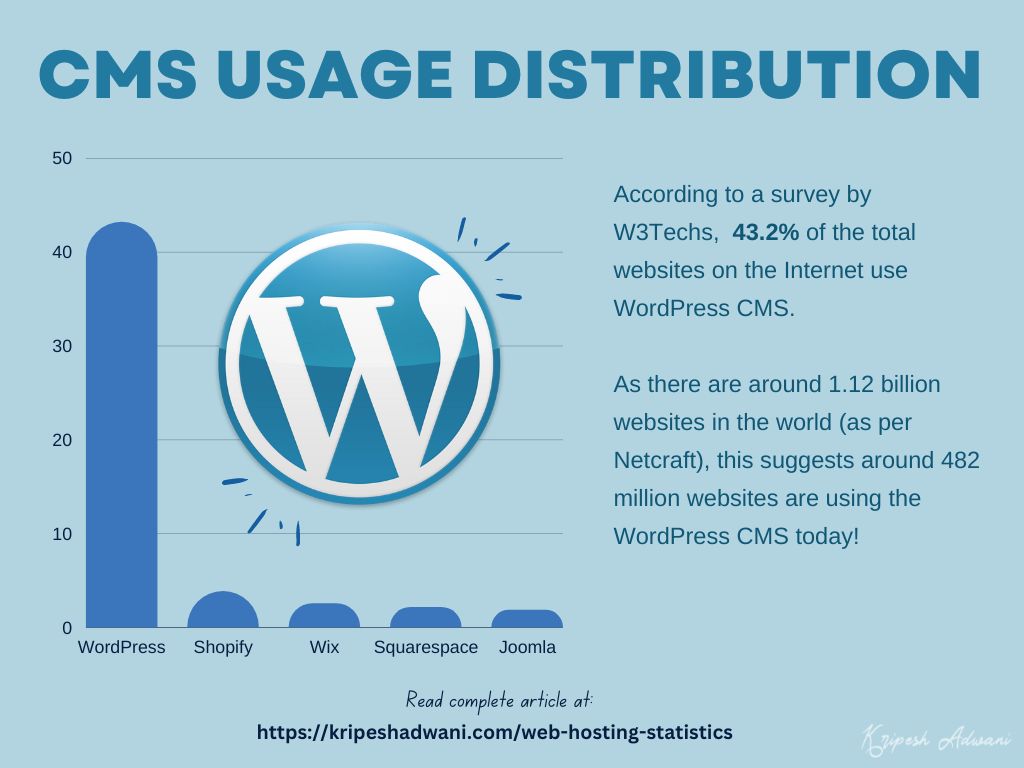
7. 43.2% of all websites on the Internet use WordPress.
43.2% of the total websites on the Internet use the WordPress CMS. Netcraft reports that there are around 1.12 billion websites in the world in 2023. This suggests that there are around 482 million websites using WordPress CMS today!
Data Source: W3Techs
Stat Observations:
WordPress is the most popular and fastest-growing CMS platform of all time. As per W3Techs, it currently holds a market share of 63.2% in the CMS industry!
A major reason for the popularity of WordPress is its open-source nature and free-of-cost availability. It also has a friendly interface that lets beginners start with no coding knowledge.
Apart from that, it also offers integration with popular platforms and a huge library of free themes and free plugins to extend the functionality and appearance of your website.
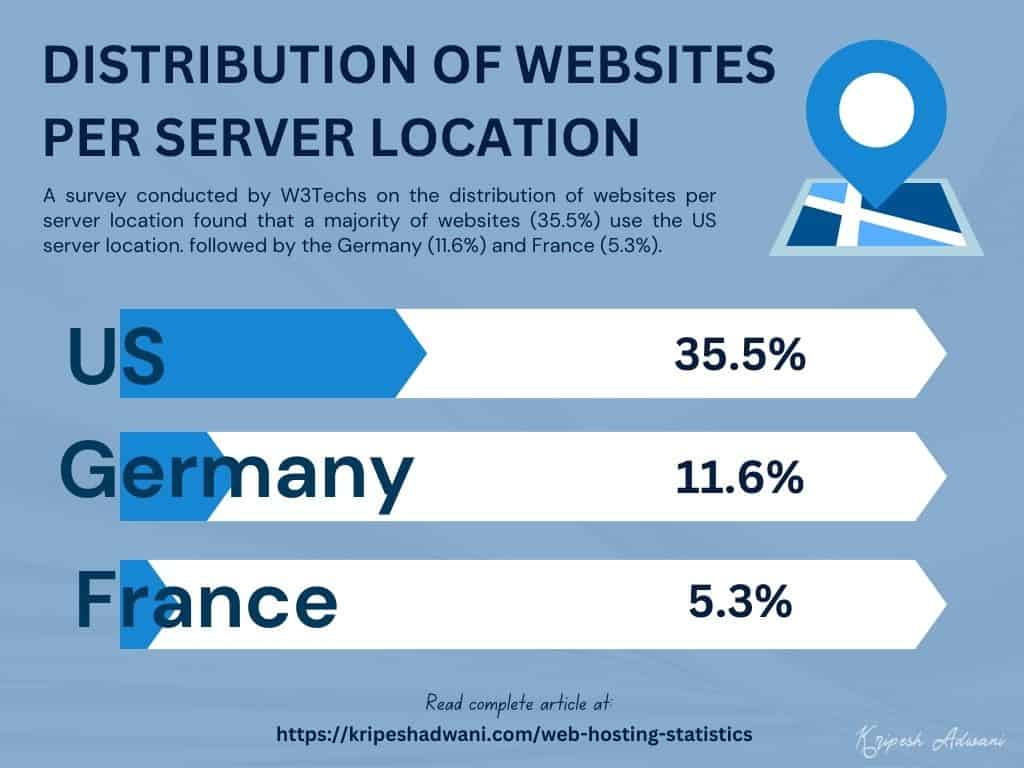
8. 35.5% of websites use the United States server location.
According to a survey conducted by W3Techs on the distribution of websites per server location, it was found that a majority of websites (35.5%) use the US server location. This was followed by the Germany location (used by 11.6% of websites) and France (used by 5.3% of websites).
Data Source: W3Techs
Stat Observations:
The US server location is a popular choice for most websites because of its large population of Internet users and the prospering digital market. It also has hundreds of popular tech companies. This is a major reason online businesses find it an attractive location for building their online presence.
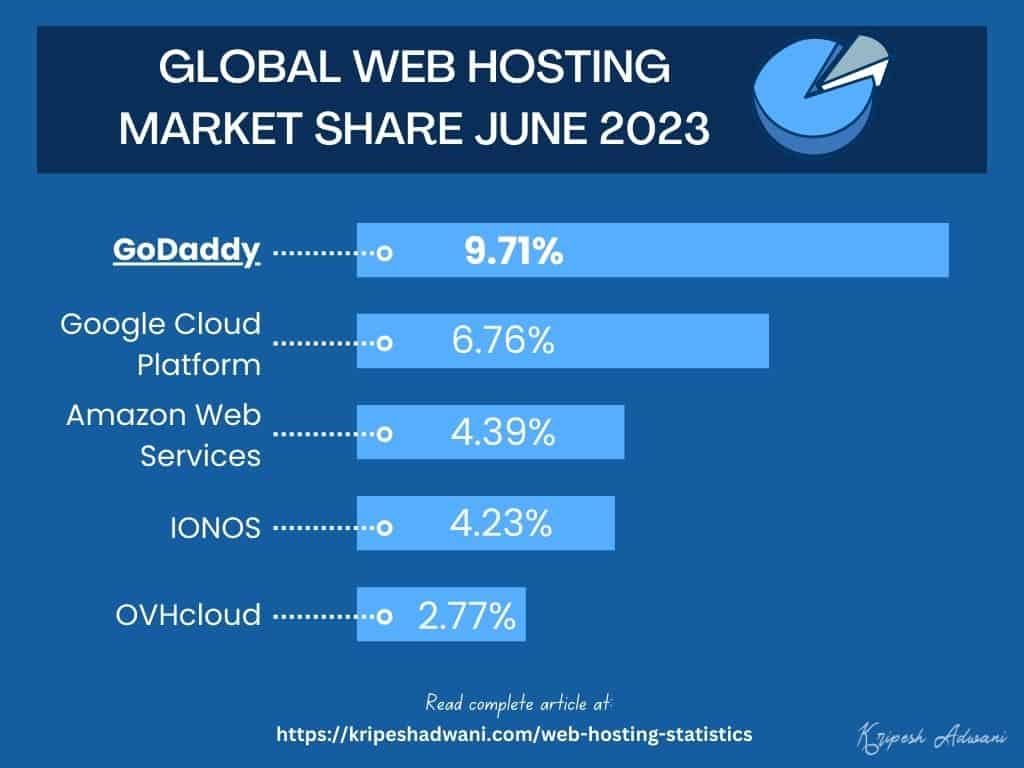
9. The most popular web hosting provider is GoDaddy, being used by 9.71% of websites on the Internet.
GoDaddy powers 9.71% of websites, which is 3.36 million websites around the world. It is closely followed by Google Cloud Platform with 6.76% of websites and Amazon Web Services with 4.59% of websites.
Data Source: HostAdvice
Stat Observations:
There are various reasons for the popularity of GoDaddy as a web hosting provider.
- It is an established player that has been in the hosting industry for a long time.
- It provides a range of hosting plans and domain registrations targeted toward the needs of different customers at competitive pricing.
- And finally, it actively runs marketing and ad campaigns to promote its services.
All of these reasons contribute to its immense popularity as a web hosting provider.
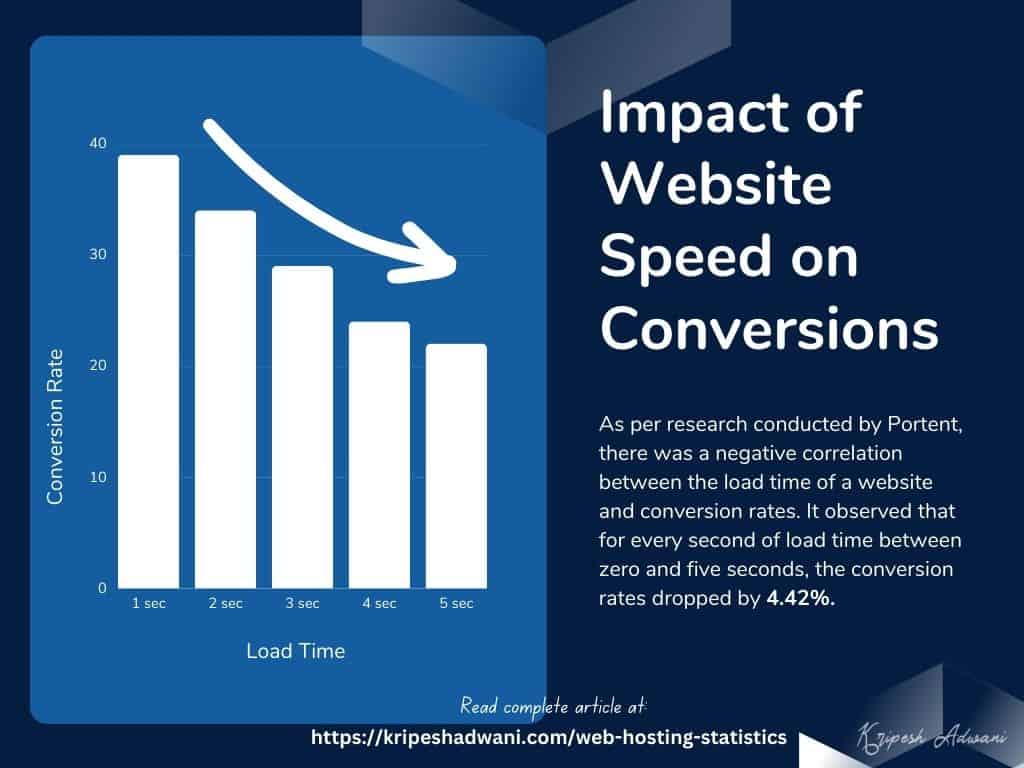
10. Website conversion rates drop by 4.42% with each second of load time that goes by between zero and five seconds.
As per research conducted by Portent, there was a negative correlation between the load time of a website and conversion rates. It observed that for every second of load time between zero and five seconds, the conversion rates dropped by 4.42%.
Data Source: Portent
Stat Observations:
There are various reasons this statistic holds true for today’s generation.
- First, a slow-loading website hampers the users’ experience by testing their patience.
- Second, the decreasing attention span of users leads to a loss of interest, and they end up jumping to another website.
- Finally, slow-loading websites negatively impact SEO and lead to decreased rankings and low search visibility, along with lesser organic traffic.
Thus, it’s best to keep your website optimized for SEO to maintain your traffic and conversions.
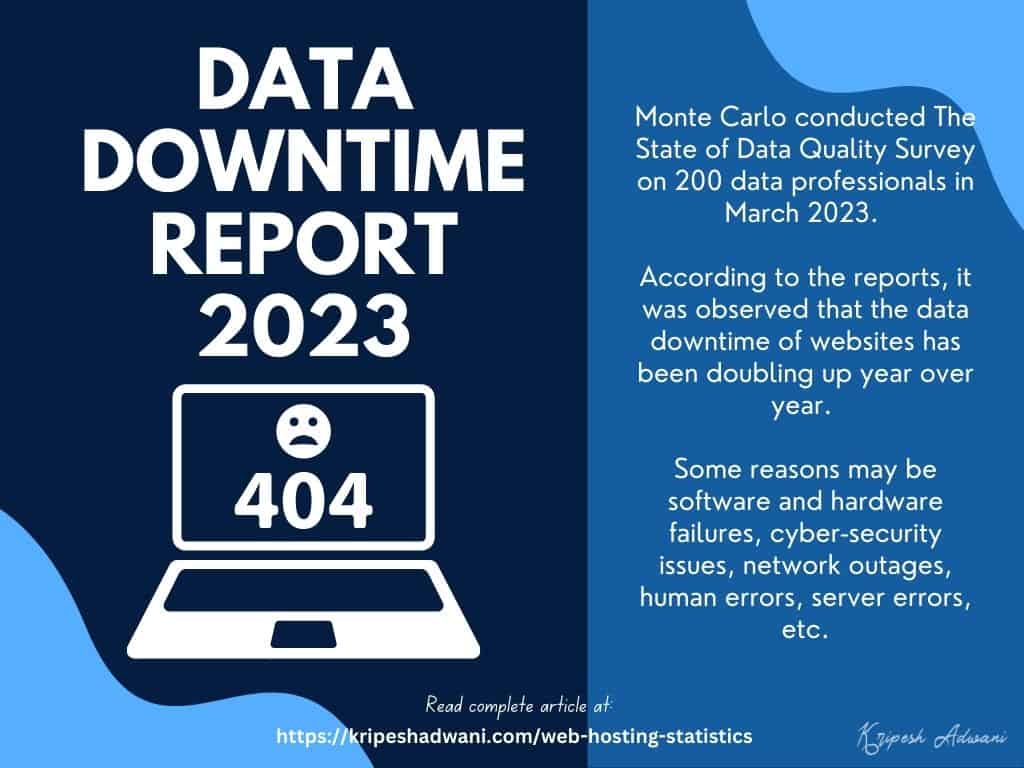
11. Data downtime multiples by 1.89 times year over year.
Monte Carlo conducted The State of Data Quality Survey on 200 data professionals in March 2023. According to the reports, it was observed that the data downtime of websites has been doubling up year over year.
Data Source: Monte Carlo
Stat Observations:
Downtime refers to the time a website remains inaccessible on the Internet. There might be many reasons for the increasing rate of downtime every year. Some reasons include software and hardware failures, cybersecurity issues, network outages, human errors, server errors, etc.
You can use tools like Uptime Robot, Pingdom, Better Uptime, etc to regularly monitor your website’s uptime.
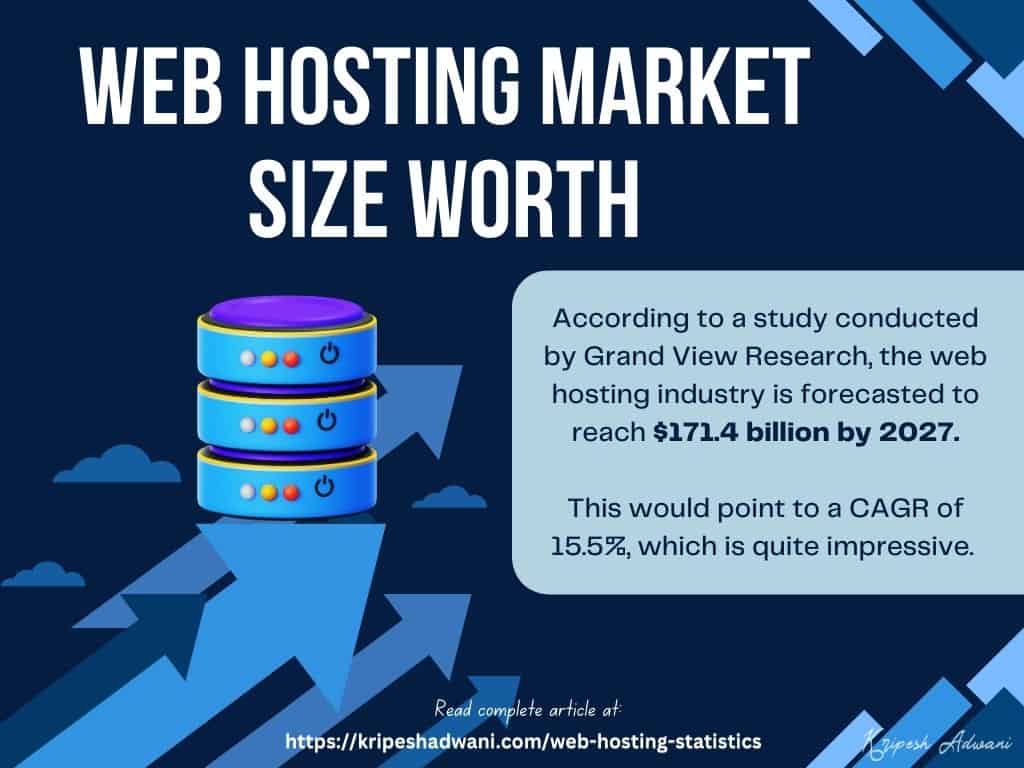
12. The web hosting industry is expected to grow to $171.4 billion by the year 2027!
According to a study conducted by Grand View Research, the web hosting industry is forecasted to reach $171.4 billion by 2027. This would point to a CAGR of 15.5%, which is quite impressive.
Data Source: Grand View Research
Stat Observations:
The major reason for this tremendous growth of the web hosting industry is the ever-increasing Internet population, along with the growing adoption of smartphones. Along with that, the number of websites and online businesses is also on the rise.
These businesses require reliable hosting solutions to establish their online presence. This has led to the rapid growth of the web hosting industry and it will continue to grow at a fast pace.
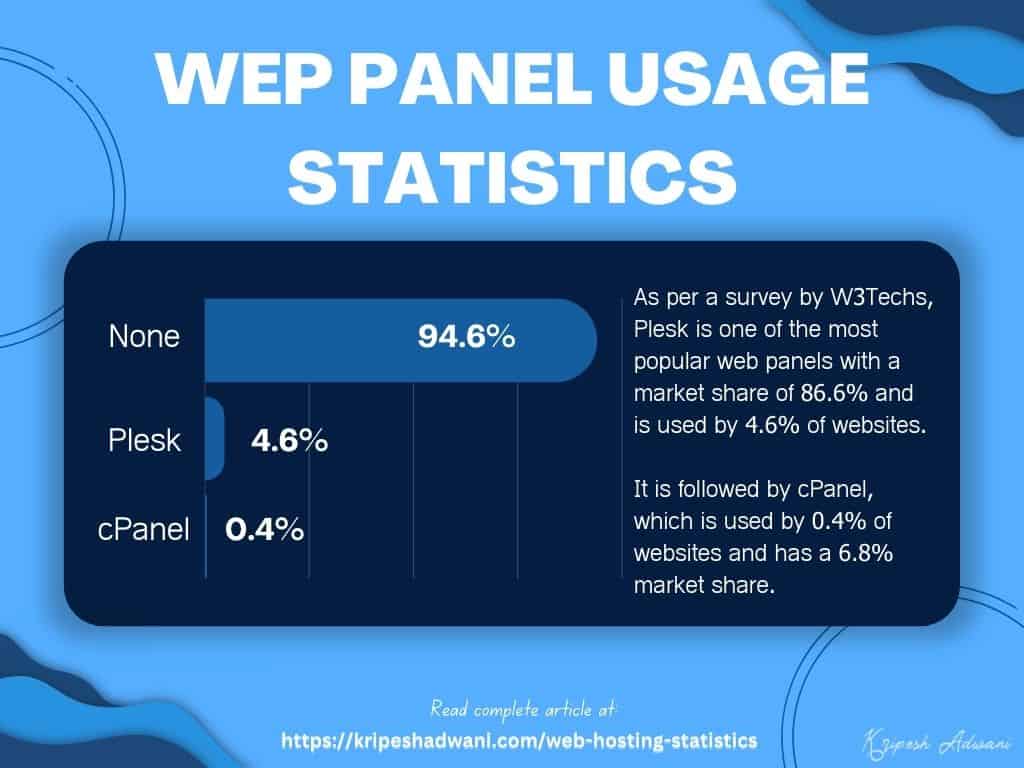
13. Plesk is the most preferred web panel with 4.6% of websites using it.
As per a survey by W3Techs, Plesk is one of the most popular web panels with a market share of 86.6% and is used by 4.6% of websites. It is followed by cPanel, which is used by 0.4% of websites and has a 6.8% market share.
Data Source: W3Techs
Stat Observations:
Plesk is preferred by many website owners because of its user-friendly interface and the availability of a range of tools and integrations for beginners and professional users.
It is a versatile web panel supporting multiple operating systems and offers reliable support with regular updates. All of these reasons contribute to the popularity of the Plesk web panel.
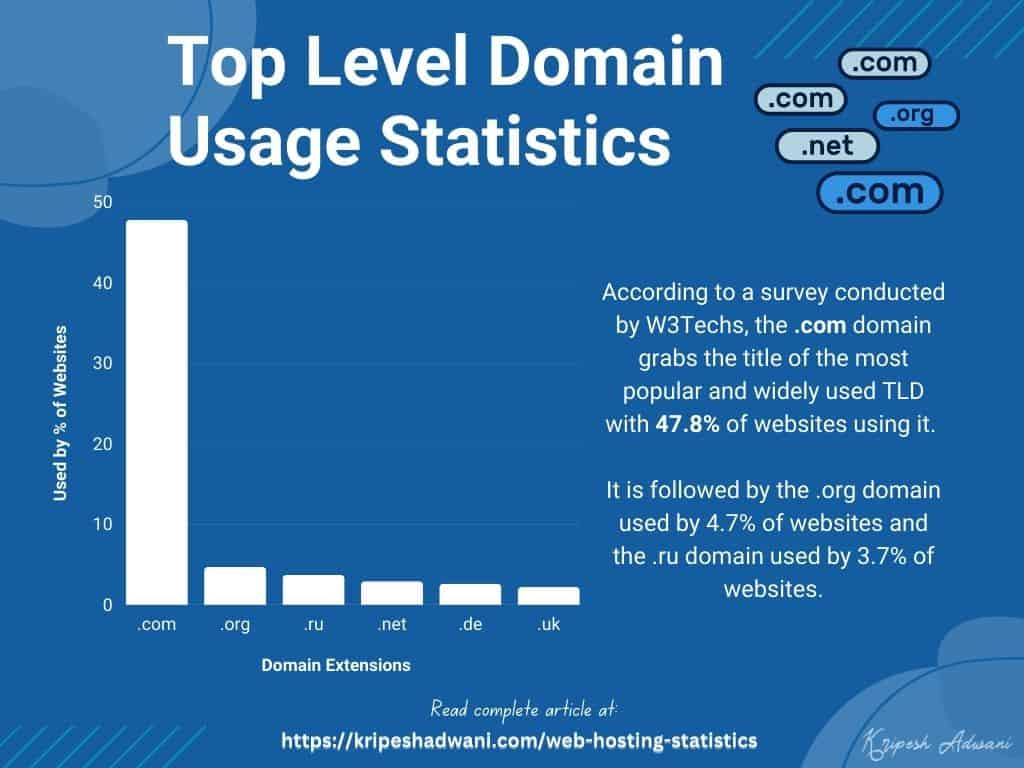
14. The .com TLD is the most popular domain extension used by 47.8% of all websites.
According to a survey conducted by W3Techs, the .com domain grabs the title of the most popular and widely used TLD with 47.8% of websites using it. It is followed by the .org domain used by 4.7% of websites and the .ru domain used by 3.7% of websites.
Data Source: W3Techs
Stat Observations:
The .com domain is one of the earliest TLDs that became popular in the 20th century. It was used by all the commercial and established websites like Google, Facebook, Amazon, etc, seeking a global reach and broad audience base.
Because of this widespread adoption, the .com domain gained a reputation in the market and became a reliable choice for businesses and personal websites.
15. .xyz is the most popular Generic TLD used by 13.09% of registered domains.
Among Generic TLDs, .xyz domain extension has been used on 13.09% of domains, which is the highest among all gTLDs. This amounts to 4,118,855 domains in total.
Data Source: NTLD Stats
Stat Observations:
The demand for the .xyz gTLD has seen a significant increase in the last few years. This domain name extension is quite affordable and is mostly used for small websites or test projects.
Because .xyz does not represent a specific country or industry, it has a global appeal and can be used for a wide range of websites.
16. As of 2023, Newfold Digital owns 80+ web hosting companies.
Newfold Digital is a web presence solutions provider that was formerly known as EIG. It has acquired a whole range of web hosting companies in the last few years. It is the parent company of 80+ hosting brands, including BlueHost, HostGator, BigRock, etc.
Data Source: Online Media Masters
Stat Observations:
Newfold Digital is a popular web technology company serving over 7 million people around the globe. Acquiring so many web hosting companies would help them expand their market presence and increase their customer base.
They could offer a wide range of services and technologies to their customers, making them a leading player in the hosting industry.
17. The most expensive domain name ever sold was Cars.com at $872 million.
According to GoDaddy, Cars.com is by far the most expensive domain name ever sold. It was sold for a whopping $872 million! The 2nd most expensive domain was CarInsurance.com (sold at $49.7 million). Insurance.com was the 3rd most expensive domain, sold at $35.6 million.

Data Source: GoDaddy
Stat Observations:
In my opinion, the primary reason the Cars.com domain was sold at such an elevated price point was because of its brand value and online presence. A premium domain name like Cars.com can provide instant credibility and is also easy to remember.
Along with that, as more and more businesses are establishing their online presence, the demand for brandable domains is increasing. Thus, this scarcity of trustworthy domain names may also be a reason for such intense competition and inflated prices of the domain.
18. In the first quarter of 2023, 58.33% of website traffic came from mobile devices.
As per a survey conducted by Statista on the share of global mobile web traffic from 2015 to 2022, it was observed that mobile traffic contributed to more than half of the web traffic!
Since the beginning of 2017, web traffic was consistently around the 50% mark. But in 2020, it permanently exceeded that mark. In the first quarter of 2023, mobile web traffic accounts for 58.33% of all website traffic.
Data Source: Statista
Stat Observations:
This survey shows a gradual shift in users’ behavior towards mobile devices since 2015. This may be because of the accessibility and convenience offered by mobile devices.
Because of this change, a majority of online businesses are now focusing on building their mobile applications and creating a responsive and optimized website experience on mobile devices for their customers.
19. 27% of small businesses don’t have a website.
According to a survey conducted by Top Design Firms in 2022 on 1003 small businesses, it was found that 27% of them didn’t have a website yet!
Most businesses planned to build their website in the next few years. This showed how there was an increased awareness among business owners regarding the importance of a website and online presence.
Data Source: Top Design Firms
Stat Observations:
The increased acceptance and usage of the Internet and technology are visible through this statistic. An online presence is essential for the growth of any small business.
Building a website allows business owners to attract potential customers from all around the world. It also lets them showcase their services and products and compete with larger businesses and establish their brand.
With the prevalence of technology in our lives, more and more businesses would be building their business websites in the coming years.
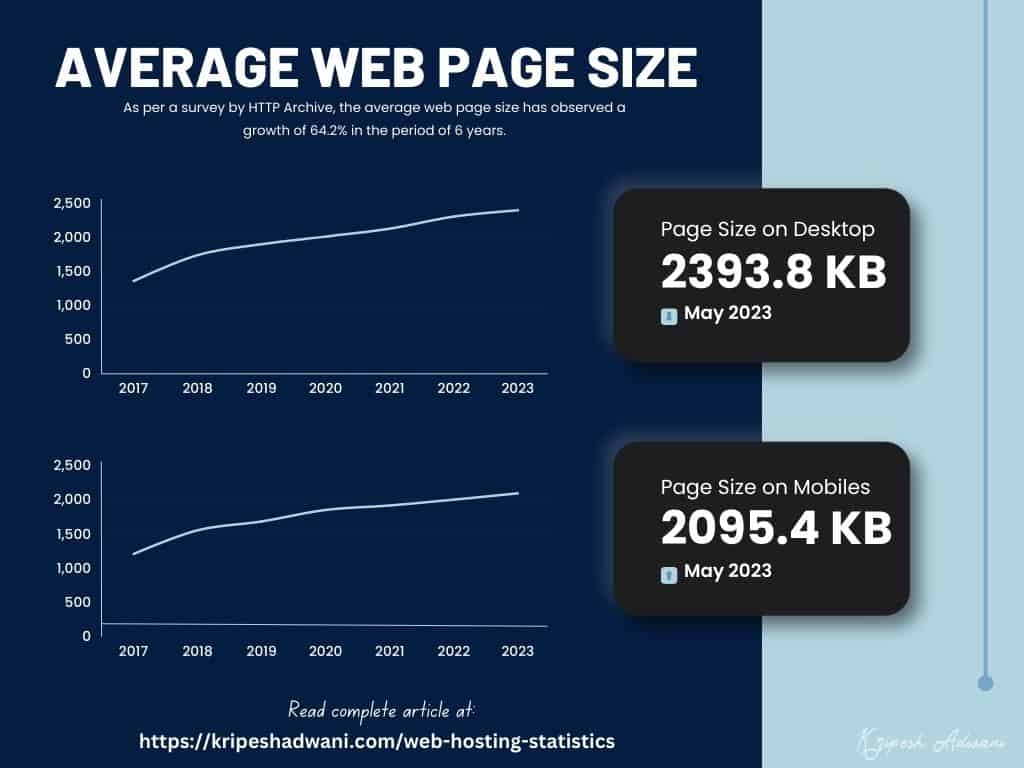
20. The average web page size has increased from 1.4 MB in 2017 to over 2.3MB in 2023 for desktops.
According to a survey by the HTTP Archive over the years 2017 to 2023, an increase in the average web page size was observed for desktop and mobile devices.
In February 2017, the average web page size was 1.4 MB for desktop and 1.3 MB for mobile. Whereas, in May 2023, the average page size has grown to 2.3 MB for desktops and 2 MB for mobile devices.
This shows a growth of 64.2% in the period of 6 years.
Data Source: HTTP Archive
Stat Observations:
An important reason for the increase in the average web page size may be contributed to the introduction of rich media content like high-resolution videos, images, and interactive elements.
Creators are now focusing on designing more engaging and attractive website experiences for users. This has also resulted in the inclusion of additional scripts, frameworks, etc leading to the overall increase in web page size.
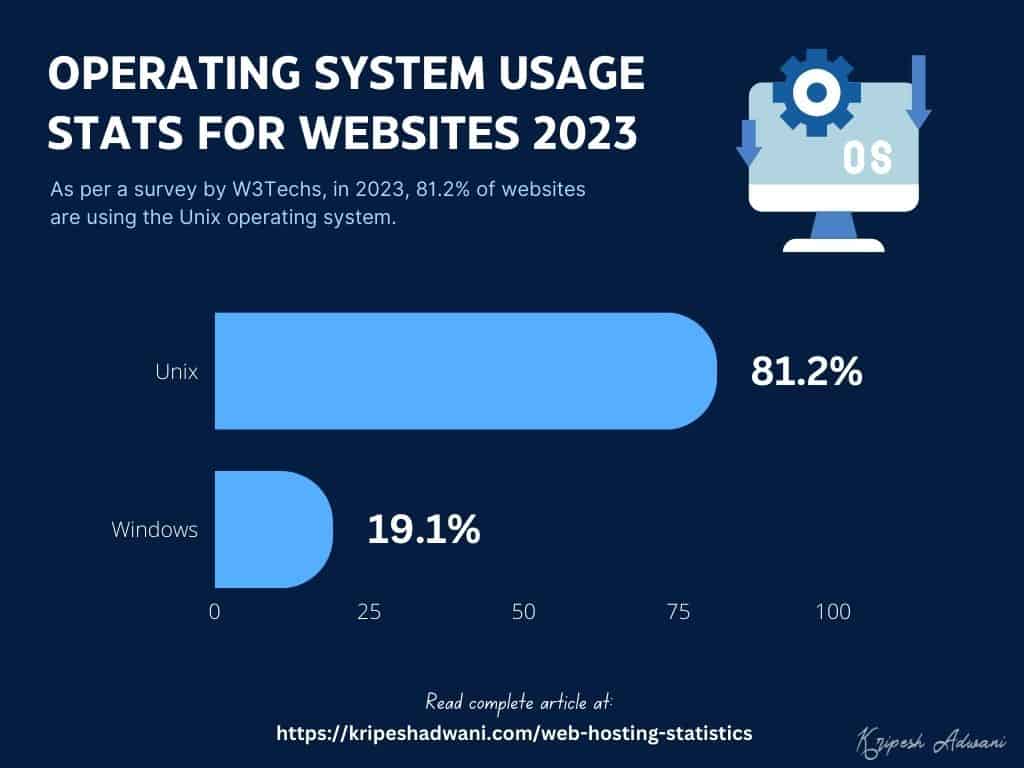
21. 81.2% of websites use the Unix operating system.
As per a survey by W3Techs, 81.2% of websites use the Unix operating system. Whereas, the Windows OS is used by 19.1% of websites.
Data Source: W3Techs
Stat Observations:
Unix OS is the preferred choice for most website owners. This is because it offers strong performance, reliability, and stability for web servers.
Unix-based operating systems (like Linux) come with a range of open-source software and tools along with community support and frequent updates. All of this makes Unix an ideal option for websites.
Conclusion
I hope these statistics help you get a better idea about the web hosting industry. If you are planning to purchase a web hosting service, you can check out these 13 Best Web Hosting in India for 2023.
Anyway, which of these statistics interested you the most? What are your personal opinions on this data? Let me know in the comments box below. This is Kripesh signing off. I’ll be back with more informative content soon. Take care and keep learning! 🙂


Great article! These web hosting statistics provide valuable insights into the industry. I found it interesting that websites hosted on VPS hosting load faster compared to shared plans. My question is, what are the key factors to consider when choosing between VPS and shared hosting?